KH
KIMBERLY HOLLOWAY SOFTWARE SOLUTIONS
Back to Featured Work
Data & Reporting

Operational Database & Reporting Solution

An end-to-end data management and business intelligence solution designed to organize operational records, improve historical visibility, calculate meaningful performance metrics, and turn day-to-day data into actionable business insights.

Microsoft Access Power BI DAX Data Management Reporting Process Improvement Dashboard Design Business Intelligence
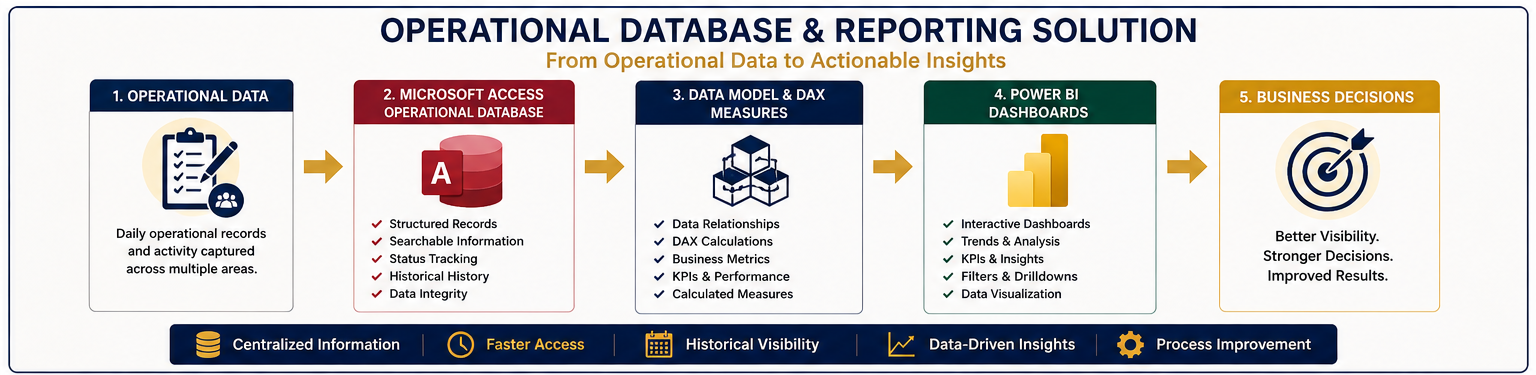
End-to-end operational data solution showing Microsoft Access, DAX measures, Power BI dashboards, and business decisions

End-to-end solution overview showing how operational information moves from structured data management to analytics, reporting, and business decision support.

Information was difficult to find and track.

Operational work generated records that needed to be reviewed, updated, tracked, and referenced over time. Without one structured location for that information, finding the history of a record could require searching through multiple sources or manually reviewing previous information.

The challenge was larger than simply storing data. The information needed to be searchable, easy to update, useful for historical review, and structured in a way that could support meaningful reporting.

Leadership and operational users also needed a clearer way to understand what was happening across the data without manually reviewing individual records one at a time.
Create a searchable system and turn the data into insight.

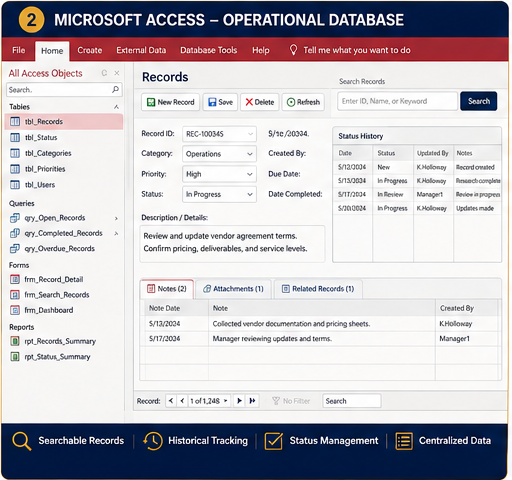
I developed a structured Microsoft Access database to centralize operational records and make historical information easier to search, review, and maintain.

The database provided a more organized way to manage records, track processing information, review history, document updates, and retrieve information without repeatedly searching through separate files or manual tracking methods.

Microsoft Access operational database showing searchable records, status tracking, notes, and record history

Fictionalized portfolio representation of the Microsoft Access database interface, including record search, status management, historical tracking, and supporting information.

I paired the structured data with Power BI reporting to provide a clearer view of operational activity. DAX measures were used to create calculated metrics and KPIs that transformed individual records into information that could be analyzed across the operation.

Together, the database and reporting layer created a solution that supported both sides of the process: managing the details of individual records and understanding the larger story behind the data.

From operational records to useful business information.

The solution was designed around the way the information was actually used. Data could be captured and maintained at the record level, searched when historical information was needed, and then analyzed through a reporting layer.

01 Capture & Organize Store operational records in a structured format.
02 Search Records Quickly locate information without reviewing multiple sources.
03 Track History Maintain visibility into previous activity and record status.
04 Structure the Data Prepare consistent operational information for analysis.
05 Calculate Metrics Use DAX measures to create meaningful KPIs and calculations.
06 Visualize & Report Use Power BI to make trends and performance easier to understand.

Give the data a management-level view.

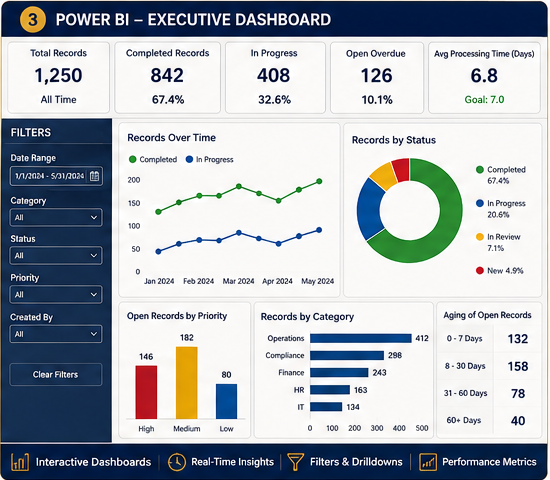
A database can answer questions about individual records, but management often needs to see the bigger picture. Power BI provided the reporting layer needed to move from individual transactions to trends, workload, status, aging, and performance information.

Interactive filters and visualizations made it easier to review the information from different perspectives without manually rebuilding reports each time a new question came up.

Power BI operational dashboard showing KPIs, status trends, filters, aging, workload, and performance reporting

Fictionalized Power BI dashboard demonstrating KPI cards, trends, status analysis, aging, workload visibility, and interactive filtering.

Build the business logic behind the dashboard.

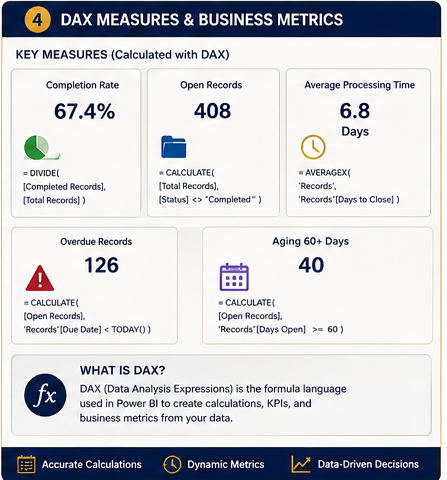
Visualizations are only as useful as the calculations behind them. I used DAX measures to define business metrics and create consistent calculations that could be reused throughout the Power BI reporting model.

Measures such as completion rate, open records, processing time, overdue records, and aging provide a clearer view of operational performance than simply displaying raw rows of data.

DAX business measures showing completion rate, open records, processing time, overdue records, and aging metrics

Example DAX-driven business measures illustrating how operational records can be converted into consistent KPIs and performance metrics.

Completion Rate

Converts completed and total records into a consistent performance percentage.

Open Work

Measures the volume of records that still require action.

Processing Time

Calculates how long work takes to move through the process.

Overdue Records

Identifies records that have exceeded a defined due date or expected timeframe.

Aging

Groups open work by age so older records can be identified and reviewed.

Trend Analysis

Makes changes in workload and performance easier to see over time.

Faster access. Better accuracy. Clearer visibility.

The solution created a more structured way to manage operational information while also making the data more useful beyond the individual record.

Users could locate information more efficiently, review historical activity, and maintain records within a consistent system. Power BI extended that visibility by making patterns, workload, status, aging, and performance easier to review at a higher level.

Faster Access Searchable records reduce the time needed to locate operational and historical information.
Improved Consistency Structured data entry and centralized information support more consistent record management.
Better Reporting Power BI and DAX turn detailed records into metrics, trends, and performance information.
Historical Visibility Users can review previous activity and better understand what happened over time.
The Bigger Idea

Good systems don't just store data. They turn scattered information into something people can actually use.

This project reflects how I approach operational technology problems. I look at how people are currently working, identify where information is difficult to manage or understand, and then build a solution around the actual business need.

In this case, that meant connecting database design, process improvement, data modeling, DAX calculations, business intelligence, and reporting into one end-to-end solution.

Is your operational data difficult to manage?

Your data should help you run the business, not slow you down.

If important information is scattered across spreadsheets, shared files, emails, manual logs, databases, or disconnected reports, let's talk about building a more structured way to manage, analyze, and use it.

Discuss a Similar Project